December 18, 2016
Abstract
The purpose of this study is to look at the
distribution of drowning incidents that occur within the city limits of Eau
Claire, Wisconsin. In doing so, studies conducted by M.S. Kappas (2012), Adnan
Turgut (2014), and Amy Peden (2016), were used to develop a comprehensive strategy
that would be employed for research methods. By conducting this research, data
was collected to develop a risk analysis of the area of interest, and the
victims associated with the drowning incidents. Data collected ranged from 2002
through 2016, and was obtained from public online news articles and local
police records. The study found that high risk demographic trends for the City
of Eau Claire, were associated with white males in their early twenties.
Furthermore, the study found that alcohol was often a prevalent factor in these
drownings. In conclusion, the information divulged from this study was then
used as a way to recommend different mitigation strategies for the City of Eau
Claire.
Introduction
Research
Question
I have
lived in the City of Eau Claire since 2012, and each year brings news to
different drowning related deaths within and around the city limits. Yet as
these incidents kept occurring, I realized that there was very little talk
within the community as to why they were happening and furthermore, how to stop
future drownings from occurring. For this reason, I wanted to look at what the
City of Eau Claire was doing to help remedy this issue. From this search I
quickly found that although some data on this topic did exist, there was
definite research gaps missing. As a result, my research question is as
follows: what areas within Eau Claire’s waterways are more prone to fatal
accidents, and what trends can be found within both victims and the locations
of their accident? From this question, the main objective of my research is to use
these locational and demographic trends to develop a risk analysis profile.
This profile would then be used to provide mitigation based suggestions for the
City of Eau Claire in order to help prevent future incidents from occurring.
According to the World Health Organization (WHO),
drowning is a process of respiratory impairment from submersion or immersion
under a liquid (2002). During the process of reviewing drowning information
provided by WHO, one fact in regards to the scope of the issue really stood out.
In 2012 WHO estimated 372,000 drowning related deaths occurred around the world
that year, making drowning the third biggest reason for unintentional deaths
globally (2012). WHO goes on to state that this estimate is based only on
recorded drownings. In reality, the annual number is actually much higher, and
differences in the total amount verses the estimated, are due to a location’s economic
ability to fund programs to correctly document each incident.
 |
Figure 1: CDC data of the different
locations of
unintentional drownings within the US during 2007 (2011).
|
These facts provided by WHO led me to
investigate national statistics within the United States. It was during this
search that the United States’ Center for Disease and Control’s (CDC) website
was discovered. From this data source I uncovered a study that looked at
drownings within the United States. Within this study, it was estimated that
about 10 individuals drown within the United States each day (2014). Since the
United States is a developed country, proper documentation methods are
frequently made available to local communities, meaning that this estimate is
much more accurate. Furthermore, during my search, I came across CDC
data from 2002 that categorized where these drownings were occurring. Within
figure 1, it can be seen that 52% of all reported drownings happen
within natural waterways (i.e. boating and natural water) (2002). According to CDC, natural waterways
include a wide range of features from rivers, streams and dams, to lakes, ponds
and oceans. In a recent article written by Amy Peden, the author states that research for drowning
prevention in specific natural water features is minuscule at best due to the generalized natural water category (2016).
Study
Area
As
previously eluded to, my research area, or area of interest (AOI) is consistent
with the city limits of the City of Eau Claire, Wisconsin. Figure 2 shows a
generalized outline of these city limits within the AOI. To develop a better
picture of Eau Claire, I pulled from sources such as the US Census Bureau and
Google Earth. From the first source, the US Census Bureau (2015) estimated a
total of 67,778 people living within the city limits in 2015, 48% being male. The
second source, Google Earth (2016), was used to find relevant observations
about the designated AOI. From this source it became rather prevalent that the
city’s Eau Claire is dominated by dense urban development that surrounds the
confluence of two different rivers, the Chippewa River and the Eau Claire.
However, Google Earth (2016) also showed other river related features such as:
an oxbow lake, multiple streams, a dam, and a resulting water reservoir. Furthermore,
the area also includes the city’s local police department, the Luther Hospital,
and two college campuses, the University of Eau Claire Wisconsin, and the
Chippewa Valley Technical College. According to the US Census Bureau (2010),
the total enrollment of students for these two colleges was 26,694 in 2010.
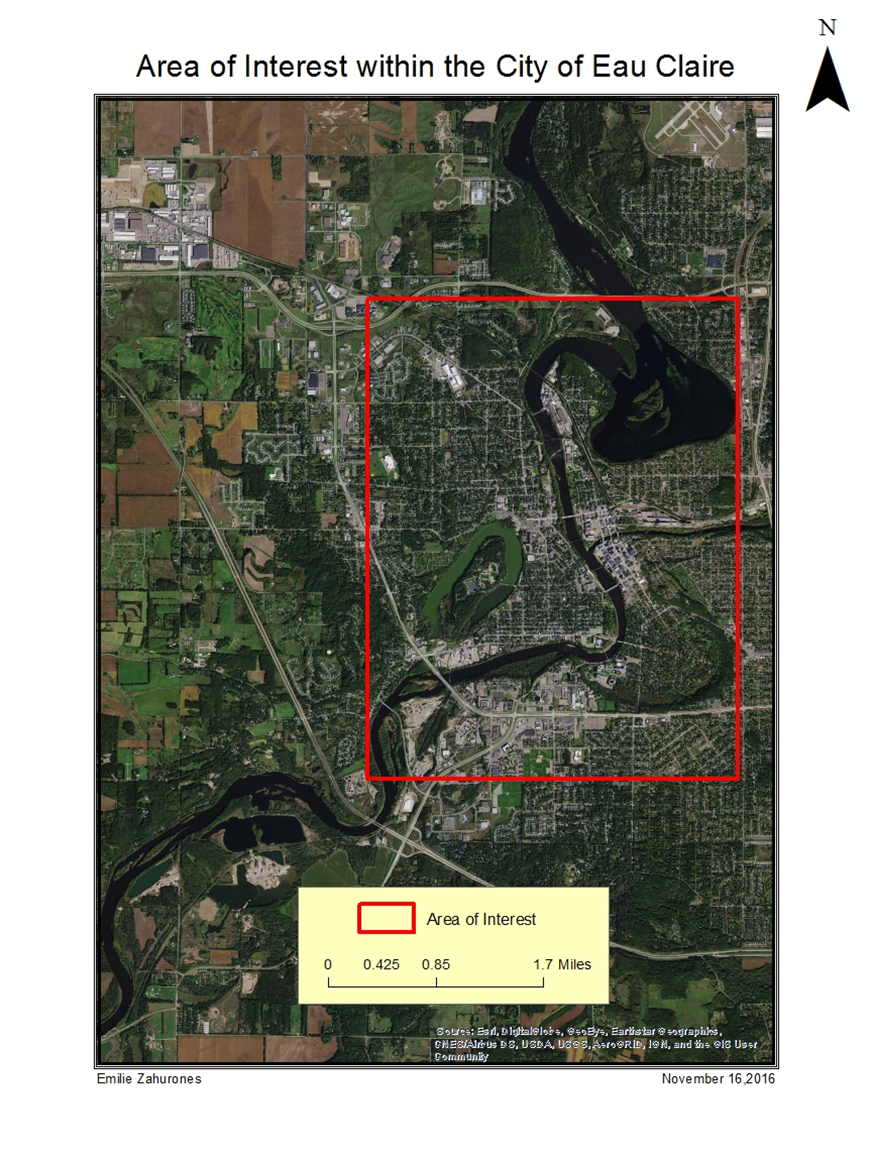 |
Figure 2: Study
location within the City of Eau Claire (2016).
|
Literature
Review
In
order to do start my research, the first step that was adhered to was finding
peer reviewed references that would formulate the structure of my project.
Although many different references were used, there were four journal articles,
that I deemed as being highly beneficial for developing the basis of my
research.
Over the course of the semester, different readings
were given to supplement our personal understanding of how our research topics
were related to the field geography. One such reading was “The Four Traditions of Geography” by William Pattison (1964).
Based on this article, I believe that my research is composed of three separate
traditions: area studies, “man-land”, and spatial traditions. The first
tradition, area studies, is because my research is endemic to the City of Eau
Claire. More specifically, my research looks at demographic and locational
trends associated with drowning incidents within city limits. The second
tradition, “man-land”, discusses the interactions people have with the
environment. In relation to my study, I looked at causes for drowning in different
river based features, and furthermore what can be done within the environment
to help prevent future incidents from occurring. The final tradition, spatial,
discusses the use of mapping techniques in order to show spatial distribution
or relation of a topic. Again, in relation to my topic, a total of nine maps
and seven graphs were made to help depict and special trends within my data.
Since
I wanted to develop a risk analysis profile, I needed to find an article that
would provide the basic structure of how to do so. This led me to “Assessing physical vulnerability for
multi-hazards using an indicator-based methodology” by M.S. Kappas (2012).
Within this study, the author discussed the flexible nature of a multi-hazard
risk analysis approach. This approach can be adjusted to fit many different
types of hazards. This is due to an indicator based approach to vulnerability. Kappas approach works by first identifying a study area and the relevant hazard
associated with it. Then, data is collected based on previously determined
vulnerability indicators. Once the data is collected, an assessment of those
indicators can be done, and considerations can be made in relation to them. I
found this useful because it provided a structural outline that could be
modeled within my research.
Since I already knew my study area, I wanted to find an
article that discussed potential vulnerability indicators or attributes,
associated with drowning. This lead me to a study entitled “A
population-based study on deaths by drowning incidents in Turkey” by Adnan Turgut (2014). Within this
article, the author discusses the current standards for recording drowning
incidents and prevention management methods used within Turkey. Turgut’s
article used online nationwide news articles over the span of five years, to
develop a risk analysis that profiles drowning accidents within Turkey. In
doing so, Turgut identified three main factors such as the victim’s sex, age,
and general location of the accident. This article provided me with a starting
point for what attributes I would include in my database. Like Turguta’s study,
I used localized online news articles to find data such as: age, sex, and
location, of individuals related to the accidents. In addition to online
articles I also supplemented my data with police records to fill in any gaps
found within my online search of the drowning victims.
The final article I used to locate vulnerability
indicators was Fatal river drowning: the identification of research gaps
through a systematic literature review by Amy E. Peden (2016). Within this
article, the author investigates different scientific literature that focuses
on river drownings, in order to identify corresponding trends associated with
victims such as: use of alcohol and nature of intent. Peden also identifies the
risk factors of incident locations, and different recommended mitigation
tactics. In doing so, the author also discusses data inconsistencies or
research gaps that should be addressed in future river drowning studies. Peden
hypothesizes that this lack of literature is due to generalized groups of
different water features. For example, Peden’s review is based specifically on
river related drownings. Yet, as the author points out, rivers are grouped into
a larger category of natural waterways. Also depicted in this category are lakes,
creeks, beaches, harbors, oceans and dams. As Peden notes, this combined
category makes finding river specific literature harder to locate. From Peden’s
review I was able to gain information on river drowning on a global scale and
see what different countries are doing to combat this public safety issue. I
also found it very useful that Peden explored both generalized and more
specific examples of mitigation methods used in regards to waterways.
Methods
The first step in my research
was to create an excel spreadsheet, figure 3, of drowning victim data. The
attributes associated with said victims were based off of research done by
Peden (2016) and Turgut (2014), and included factors such as; victim’s age, sex, their nature of intent and the possibility of alcohol in the bloodstream. Based on my
location, and research objective, I also chose to add in attributes such as:
generalized coordinates of the initial incident, month and year that the incident
occurred in, and finally if the victim was a college student or not. To find
this data I utilized three different sources, online newspaper articles and
police reports, from 2002 to present, and Google Earth (2016).
 |
Figure 3: Part of the excel
spreadsheet created to exhibit drowning victim data (2016).
|
The first source was based on a similar study conducted
by Turgut (2014), and pertained to the demographics of drowning victims within
Turkey. To do so, Turgut (2014) used online newspaper articles as the main
data source. Turgut (2014) chose this source because he wanted to use data
that was readily available to the public. This is how I also decided to start
my victim data search, and was thus provided with my study’s time frame. The
second source I used, police reports, was used as a filler method to complete
any data gaps associated with the victims. Lastly Google Earth (2016) was used
to collect generalized points of longitude and latitude. Since no data
exists for the exact locations of the drowning incidents, location had to
established through newspaper articles, police records, and my personal judgement, thus generalizing them to specific
locations based on those sources.
The next step in my research
was to create a geodatabase from the excel spreadsheet previously developed. To
do this I had to assign domains to the different attributes associated with the
data in ArcCatalog. Once this was done, I then had to create a point based
feature class from the generalized locations of the incidents, meaning
longitude and latitude points. Since the attribute table did not have
designated coordinate system, USGS 1984 was applied to the point feature class
to give them an accurate position within ArcMaps. From the newly created
geodatabase, the point feature class was then added into ArcMap in order to
locate areas within the AOI that were associated with locations
collected. The new attributes table and risk analysis map were then used to
find demographic and locational trends associated with the drowning incidents
collected.
Results
Based on the data collected, there were 22 different
drowning incidents that occurred within the City of Eau Claire from 2002
through 2016. Of those 22 incidents, the general locations were found
for 20. High risk locations were determined by the proximity of the incidents
to one another. Based on this criteria, three separate locations were
determined: Riverview Park, Lake Street Bridge, and Half Moon Beach. Figure 4
is the spatial representation of the 20 incident locations.
 |
Figure 4: Locations within the
study area that are associated with drowning incidents (2016).
|
 |
Figure 5: (Above)
The distribution of sex for the City of Eau Claire’s drowning victims from
2002-2016 (2016).
|
The
second attribute I looked at was the ethnicity of the victims. Also based off
of police records, four generalized ethnicities were reported: “White”, “Black”,
“Hispanic”, and “Asian”. Within this distribution a high portion of the victims
(18) were reported as being “White”. Whereas only 2 victims were reported as
being “Black”, and only one victim for both “Hispanic” and “Asian”
respectively. Figure 6, shows this
trend of ethnicity.
 |
Figure 6:
(Below) Distribution of victims’ ethnicity based on data provided by the City
of Eau Claire Police Department (2016).
|
Furthermore,
victims’ ages ranged from 4 years old to 91 and were divided into seven age
groups: 0-9, 10-19, 20-29, 30-39, 40-49, 50-59, and 60+. Of the seven
categories, highest number of incidents occurred within the 20 to 29 age group.
This age group included 8 out of the 22 victims or 36% of the total incidents. Figure
7, is the spatial representation of age within the different age categories.
Whereas figure 8 is a graph showing
the number of victims per age group.
 |
Figure 7:
The distribution of age for the victims from 2002-2016 by grouping (2016).
|
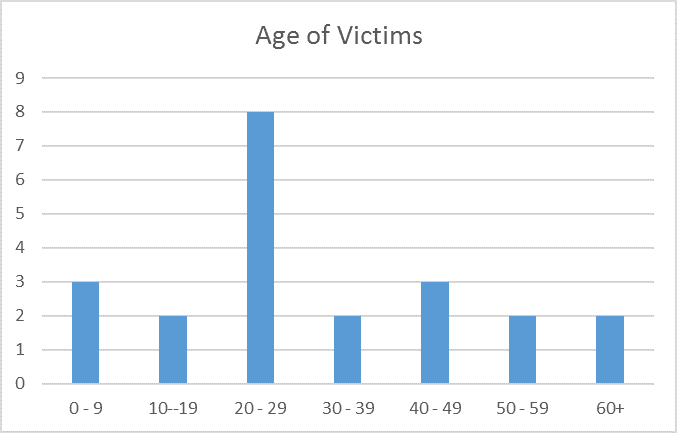 |
Figure 8: The
number of victims per age group (2016).
|
The
next set of trends I examined were: the consumption of alcohol, the overall
nature of the incident, the season or time of year that correlates with these
incidents. For the first factor, figure 9 shows that only 39% (9 victims) of
the incidents were associated with use of alcohol as a contributing factor,
with an additional 9% where use of the substance was undetermined. However, of
the 9 confirmed cases of alcohol use, 78% of them occurred within the 20-29 years
old age group. Figure 10 is a bivariate map showing this spatial distribution.
 |
Figure 9: Distribution
of whether alcohol was a factor in drowning incident (2016).
|
 |
Figure 10:
Distribution of age in association with alcohol as a factor (2016).
|
The
second factor in review was the nature of the incident. Figure 11, depicts 73%
of the 22 cases were deemed as accidental in nature, with again only 9% of the
incidents being intentional. In relation to these non-accidental incidents, the
two cases were both in correspondence with older, non-college aged individuals.
Figure 12 is the corresponding locations in relation to victim intent.
 |
Figure 11:
Incident intent expressed as percentages (2016).
|
 |
Figure 12:
Locational distribution of incident intent (2016).
|
Lastly,
I looked at seasonal trends in relation to the incidents. As figure 13
demonstrates, almost half of the incidents or 9, occurred during the summer
months (June, July, and August), making this season the most dangerous for
drowning incidents within Eau Claire. This is then closely followed by Fall,
with 7 incidents. Although it could be noted that most of the Fall incidents
occurred within the warmer, early months. Figure 14, shows the month for each
of the resulting months.
 |
Figure 13:
The number of incidents per season (2016).
|
 |
Figure 14:
Locational distribution of the month of incident occurrence (2016).
|
Discussion
To
begin my discussion, I would like to conduct a profile comparison of high risk demographics
with my results, and CDC statistics. In relation to the CDC, both figures 15
and 16 are graphs demonstrating the national distribution of high risk
demographics. When looking at figure 15,
which looks CDC (2011) statistics of age and sex of the victims, is compared
with figure 5 and 8, it can be seen that the City of Eau Claire demonstrates
similar results for these factors. That is, the victims associated with the
City of Eau Claire are most males with the largest age group of victims being
20-29 years old, more specifically 20 to 23 years old. Figure 15 shows that the
group of victims associated with national drowning statistics are males, 20-24
years old. Furthermore, it can be seen that according to the CDC study (2011),
men have a disproportionally high number of male victims compared with female
victims. I found it interesting that this too, was the situation within the
City of Eau Claire.
 |
Figure 15:
Age and sex comparison of natural waterway drowning victims in the
US from 1999
to 2007 (CDC, 2011).
|
Figure
16, is CDC (2011) data that looks at the ethnic distribution of the victims
associated with drowning. It is within this region of data, that the comparison
between my AOI and the United States differs. When looking at age in relation
to ethnicity, Eau Claire statistics seem to match up with CDC (2011) records.
This means that within figure 16 age group associated with the highest rates of
drowning for both “White” and “Hispanic” is 20-25 years old. As previously
mentioned, the majority of Eau Claire based drownings occur within “White”
males, aged 20-29 years old.
 |
Figure 16:
Ethnicity rates for drowning per age group (CDC, 2011).
|
As for the one victim that was identified as being
“Hispanic”, he was 22 years old. Whereas
CDC (2011) records show that the main age for victims who are identified as
“Black” is 15 to 19. Within my results, there were two cases of victims being
identified as “Black”, their ages being 15 and 16. What differs is that the
drowning risk for “minorities” is much higher than what my results for Eau
Claire shows. This is due to the ethnic makeup of the City of Eau Claire. According
to the US Census Bureau (2015), in 2010 Eau Claire was mostly comprised of
“White” identified individuals (91.4%). Although this is only census data from
year, a quick search of past census data yielded the same result.
Furthermore,
the CDC also states that of all drowning related incidents, roughly 70% involve
the use of alcohol. I found this interesting because although my data results
showed only 41% of all the incidents involved alcohol, 78% of those incidents
occur within the 20-29 years old age group. To me, this result shows that the
even though the City of Eau Claire is below the national percent, this factor
is a major issue within the main high risk age group.
As
previously mentioned, based on my research I found three main locations for
high risk of drowning These locations can be seen by figures 17, 18, and 19.
According to a recent study conducted by Roger Falconer (2016), the author
looks at dangerous factors for people associated with flooded river ways. These
factors include: hydraulic jumps or changes in velocity, drop offs into high
velocity, and unstable footing. Figure 17 looks at drowning incidents by
Riverview Park. Within this location four different drownings occurred between
my time frame. In relation to a bathymetric map created by Sean Hartnett
(2014), this area signifies a steep drop off into higher velocity waters. The
location of three of the incidents occurred off of an impromptu beach no
mention of the associated hazard. The second location occurs near the Lake St. bridge,
and is associated with two of the known locations. Although the number of
incidents is much smaller than Riverview Park, this location does have a higher
velocity current that goes underneath the bridge. When flooded, this area
becomes more dangerous. The last location is associated with Half Moon Beach.
Although this location is relatively shallow with
no current, thus issue associated with this location is alcohol. Or more
specifically drunk individuals going to the beach to swim.
 |
Figure 17:
The first high risk location in discussion, Riverview Park (2016).
|
 |
Figure 18:
The second high risk location in review, Lake Street Bridge (2016).
|
 |
Figure 19:
The last high risk location talked about, Half Moon Beach (2016).
|
But what can be done in these locations? One organization
called, the Eau Claire Water Safety Task Force, is working on the task. This
task force is a volunteer based organization whose purpose is to provide both
information and mitigation methods to the community of Eau Claire. Some of
these methods include: school talks, life jacket loaner boards, and life jacket
give-aways. More specifically, school talks are given yearly to all 5th
grade classes within the city limits, and one during orientation for incoming
college freshman. Whereas the loaner boards are located by two of my high risk
locations, Riverview Park and Half Moon Beach. Furthermore, life jackets are
given away every Father’s Day.
It is because of this task force
that Eau Claire’s water safety concern is much more advanced than many other
communities with similar situations. However, I believe that there is still
room for improvement. According to Peden (2016) some mitigation methods
include: fencing and signage, depth gauges, life jackets, and water safety
related programs and policies. Peden (2016) further mentions more specific
tactics such as educational programs specifically meant to target the high risk
demographic, and providing free life jackets as popular swimming venues. The
Eau Claire Water Safety Task Force has provided both educational programs for
mainly 5th graders, and free life jacket opportunities for within
the community. Yet based on Peden’s (2016) recommendations, fencing and
especially signage could be improved within areas of the river that may not be
easily supervised locations such as underneath Lake St. Bridge and by the make
shift beach at Riverview Park. Furthermore, more extensive educational programs
need to exist within the target demographic. This means water safety programs
or even clubs that work towards providing information for safe water practices.
My last recommendations are larger scale options that are listed by WHO (2016)
and complement Peden’s (2016) work, this include: making swimming lessons for a
specific grade mandatory, strengthening public awareness through media based
methods, coordinate different organizations and government sectors to develop a
water safety mitigation plan, and lastly to conduct proper research on the
locations and conditions associated with high risk locations.
Based on my research, it was discovered that the target
demographic for drowning, are “White” males, within their early 20’s.
Furthermore, the data shows that in this demographic, alcohol was often a
factor for the incident. Locationally, dangerous areas are associated with
sudden drop offs, high velocities, lack of supervision, and unstable footing.
Based on this knowledge, my final recommendations for the City of Eau Claire
would be to first develop a water safety plan that would provide a delegated
funding for warning signs, and at times fencing in locations along the river
that lack supervision. The plan would also outline educational programs meant
for different ages among the community. My last recommendation would be to
conduct more in depth studies on high risk locations. This would provide better
insight as to where future mitigation based infrastructure should be located.
When first starting my research, I thought that the City
of Eau Claire lacked many of the mitigation methods needed to make the area’s
waterways safe. After conducting my research, I believe that Eau Claire is well
on its way to truly making high risk locations safer for the community. In
essence, the City of Eau Claire has the materials to build something great, all
we need now is the man power.
Acknowledgements
I would like to
thank, Department of Geography and Anthropology for providing me with the
resources needed to conduct my research, my mentors, colleagues, and Professor
Garry Running for allowing me to bounce ideas and opinions in regards to my
research off of them, and both Dave Whitehouse and Chris Jaeger for taking time
out of their busy schedules to provide interviews and data regarding my
research.
References Cited
Center
for Disease and Control. “Drowning Risks in Natural Water Settings.” June 13,
2012. Accessed October 2, 2016. http://www.cdc.gov/Features/dsDrowningRisks/.
Eau
Claire Area Economic Development Corporation. “Eau Claire Demographic
Information.” 2016. Accessed October 2, 2016. http://www.eauclaire-wi.com/demographics/.
Kappes,
M.s., M. Papathoma-Köhle, and M. Keiler. "Assessing physical vulnerability
for multi-hazards using an indicator-based methodology." Applied Geography
32, no. 2 (2012): 577-90. doi:10.1016/j.apgeog.2011.07.002.
Kvočka,
Davor, Roger A. Falconer, and Michaela Bray. "Flood hazard assessment for
extreme flood events." Natural Hazards 84, no. 3 (2016): 1569-599.
doi:10.1007/s11069-016-2501-z.
Peden, A. E., R. C. Franklin & P. A. Leggat (2016)
Fatal river drowning: the identification of research gaps through a systematic
literature review. Injury Prevention, 22, 202-209.
Turgut, A. (2014) A population-based study on deaths by
drowning incidents in Turkey. International Journal of Injury Control and
Safety Promotion, 21, 61-67.
US Census Bureau. “QuickFacts, Eau Claire City,
Wisconsin.” 2015. Accessed October 2, 2016. http://www.census.gov/quickfacts/table/PST045215/5522300,55035.
World Health Organization. “Drowning.” September 2, 2016.
Accessed October 2, 2016. http://www.who.int/mediacentre/factsheets/fs347/en/.
No comments:
Post a Comment